Note: What is described below applies to Windows Vista x64 (at least I used such OS). I’m not going to describe what to do with a mini dump – how to analyze it in a debugger (e.g. in Visual Studio); such information can be found in a very good article at CodeProject. What I’m going to present here is how to set up Windows Vista so that mini dumps are created when an application crashes, and enforce they are stored locally on the machine on which that happened.
I believe every developer uses debugger while product creation. However it’s also possible to debug the application after it’s delivered to the client. One of such techniques is postmortem debugging – the act of debugging the memory dump of a process, which is stored in a special file (not human readable).
Microsoft has created a special service – Windows Error Reporting. Prior to Vista, Dr. Watson was default Windows application debugger that created crash dumps. Starting with Vista, Microsoft has replaced Dr. Watson with a new, improved mechanism. In short (supposing Windows Error Reporting is enabled), if an application crashes a mini dump (representation of the state of the process) is created. Mini dump is much smaller but still provides plenty of needed information. Depending on settings, a mini dump can be sent to Microsoft for further analysis. This is default behavior which, at least in my case, resulted in no mini dumps stored locally on the machine where the crash took place.
In order to enforce storing mini dumps locally (so that I could collect them in for the sake of debugging) I had to make a couple of additional steps:
- Add ForceQueue key to Windows registry at the following location: HKEY_LOCAL_MACHINESoftwareMicrosoftWindowsWindows Error Reporting; this should be DWORD with value of 1.
- Change error reporting settings so that user is always asked before sending data to Microsoft. This can be done in Control PanelSystem and MaintenanceProblem Reports and SolutionsChange settingsAdvanced settings.
First setting results in mini dumps being stored at c:UsersXXXAppDataLocalMicrosoftWindowsWERReportQueueReportXXX. However, without the second step it was automatically send with the report to Microsoft – at this point it was not possible for me to get the dump for that crash (correct me if I’m wrong, but I caouldn’t…).
Let’s assume an application crashes now. Go to Control PanelSystem and MaintenanceProblem Reports and SolutionsXXX and open the appropriate item on the list. You should get such window:
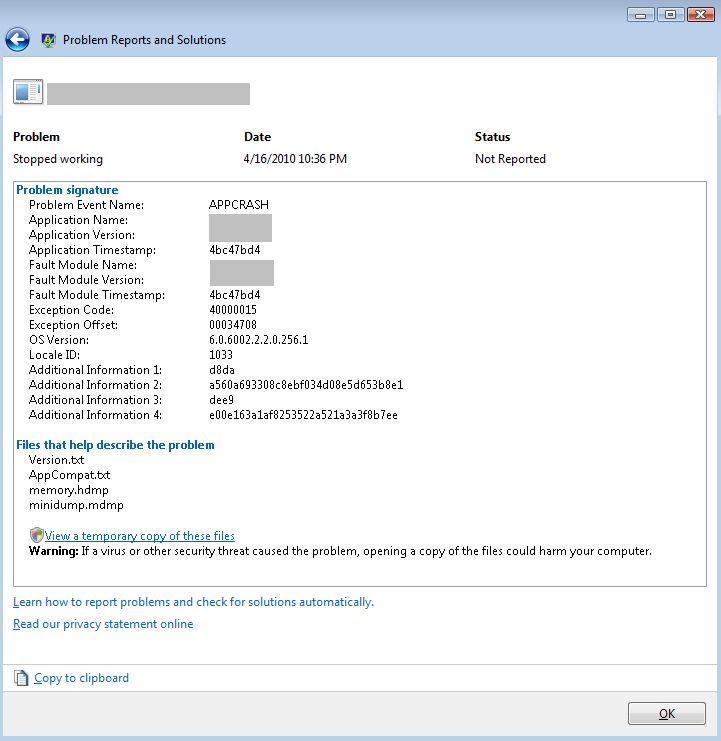
When you click ‘View a temporary copy of these files’ you will be moved to the folder that contains the dump. Now that you have the dump, you can open it in Visual Studio and start debugging it. Please bear in mind in order to debug the dump you will need debug information (e.g. pdb files). You will probably need a few more modules, for example kernel32.dll but they are easy to collect with Visual Studio. Again, for more details on how to work with mini dumps please refer to this article on CodeProject.